Quality Strings designs and manufactures custom bass strings for upright and grand pianos
Additionally the plain wire unisons can be improved through rescaling
Quality Strings researches and develops objective methods to analyze and optimize results
Here are some examples of analysis used to improve string design and fabrication
Example analysis
We record every note of an instrument with a consistent procedure and with the best equipment, to provide the raw data for spectral analysis. Go to the introduction for more info
MATLAB® offers an extensive range of tools to analyze the data objectively. To give a first impression, here are some examples
We compare two recordings of note F1 (F Contra) or key 9 of a 2002 Yamaha C5 grand. The first recording is the original string and the second is the same instrument with the only change being a Quality String
Below are 3 example analysis of those recordings
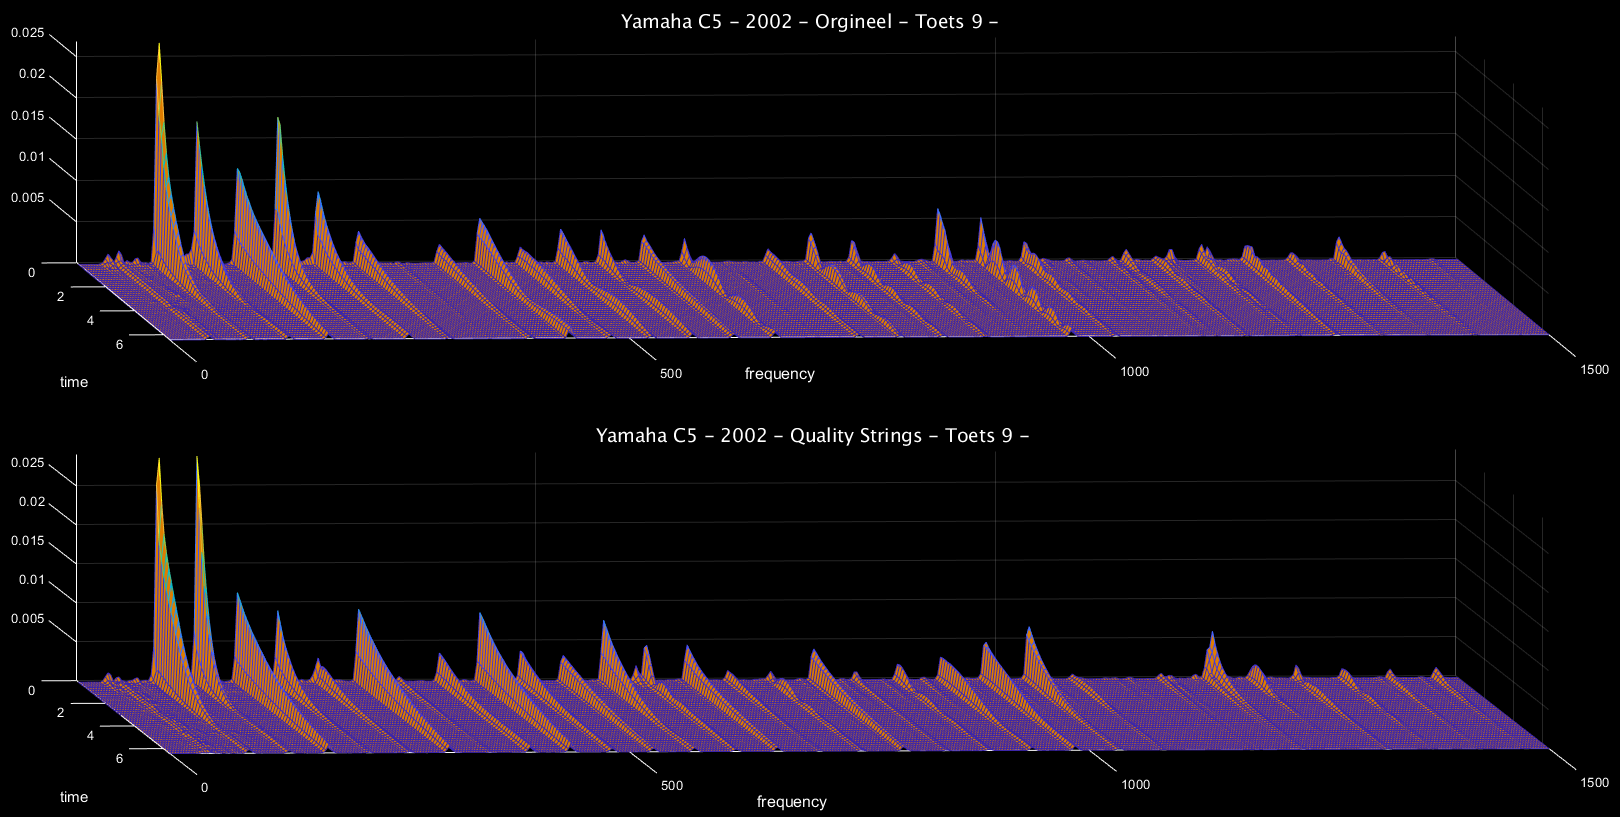
1 - Spectrogram
2 - Cumulative line spectrum
3 - Tonal center
1 - Spectrogram
A spectrogram shows which frequencies can be heard at what volume during a recording
The vertical axis shows the volume, the horizontal axis the frequency in Hz and the third axis shows the time in seconds
The top graph is the original string, the bottom one the Quality String
Click on the buttons below the image to listen to the recordings
Which partials are audible at what level can clearly be seen in a spectrogram. The root note for F1 is 43.7 Hz, it cannot be reproduced properly by the soundboard as can be seen by the flat line at that frequency. The 1st harmonic partial at (43.7 * 2) 87.4 Hz has a good volume, visible as a high peak
Some of the audible and now visible differences between the recordings:
• 2nd overtone louder with the Quality String
• The original string shows volumes moving up and down for many of the partials, as shown by the bumpy lines. With the Quality String, many partials are not only louder but also have a smoother volume gradient which can be heard as a better defined, more stable tone
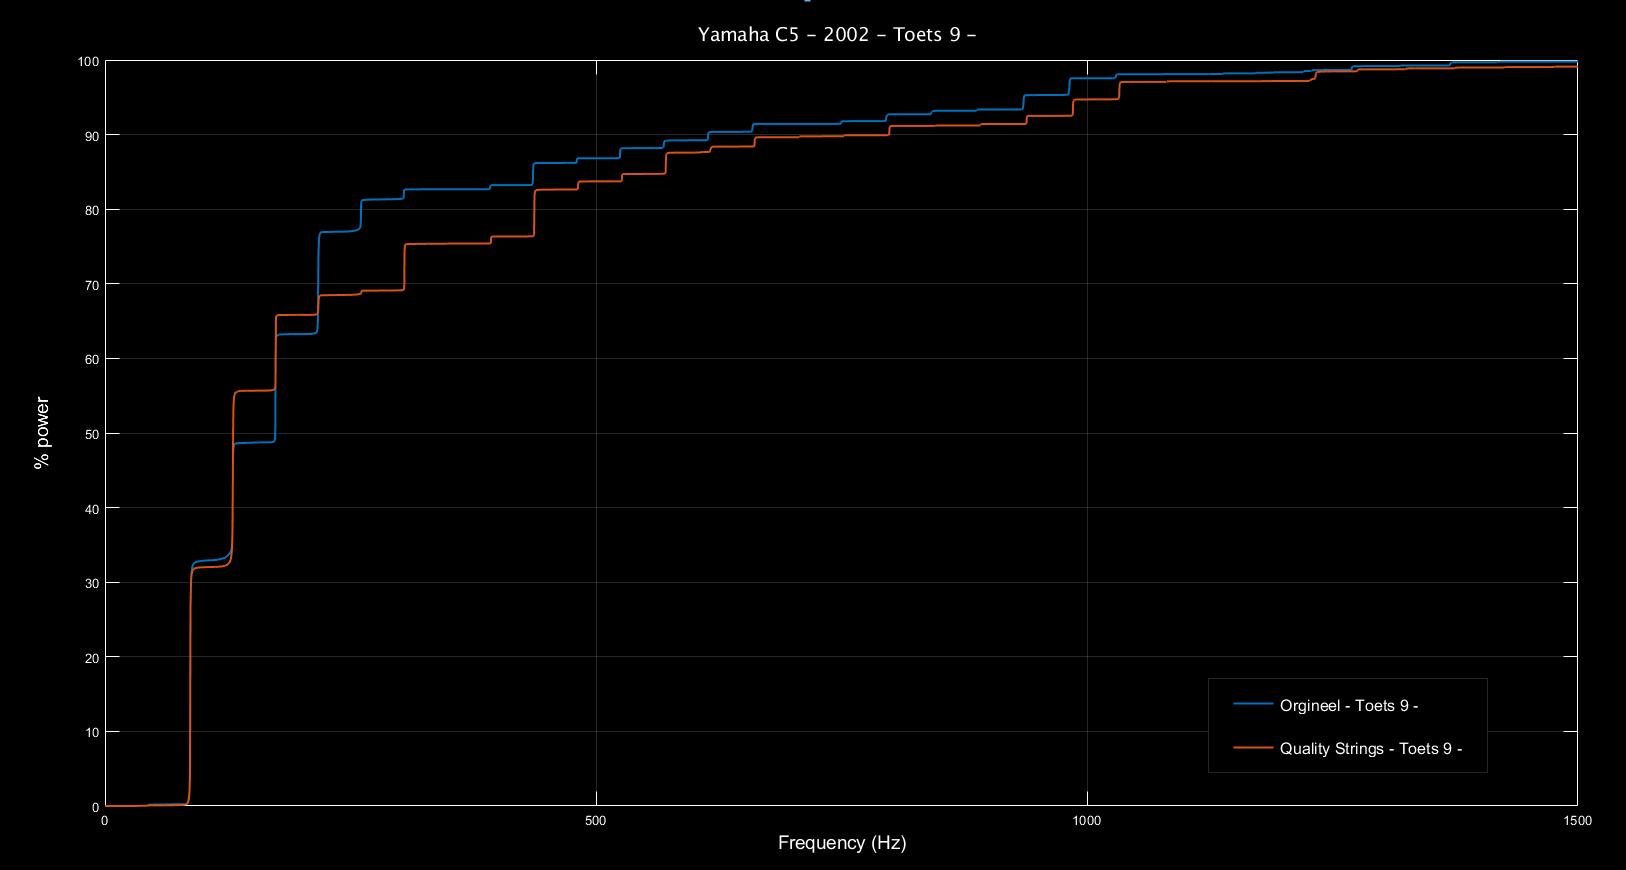
2 - Cumulative line spectrum
The cumulative line spectrum shows how much of the total volume the different frequencies represent
The vertical axis shows the relative volume as a percentage of the total volume (100%), the horizontal axis shows the frequency in Hz. The original string is again shown in blue and the Quality String in orange
For both strings, the first audible frequency, the 1st partial, represents approximately 33% of the total volume. Including the 2nd partial, the original string is at 48% of its total volume, the Quality String is at 66%. It is also clear that the 4th overtone is stronger with the original string, as shown by the spectrogram. For the 5th and 8th partial it is the other way around
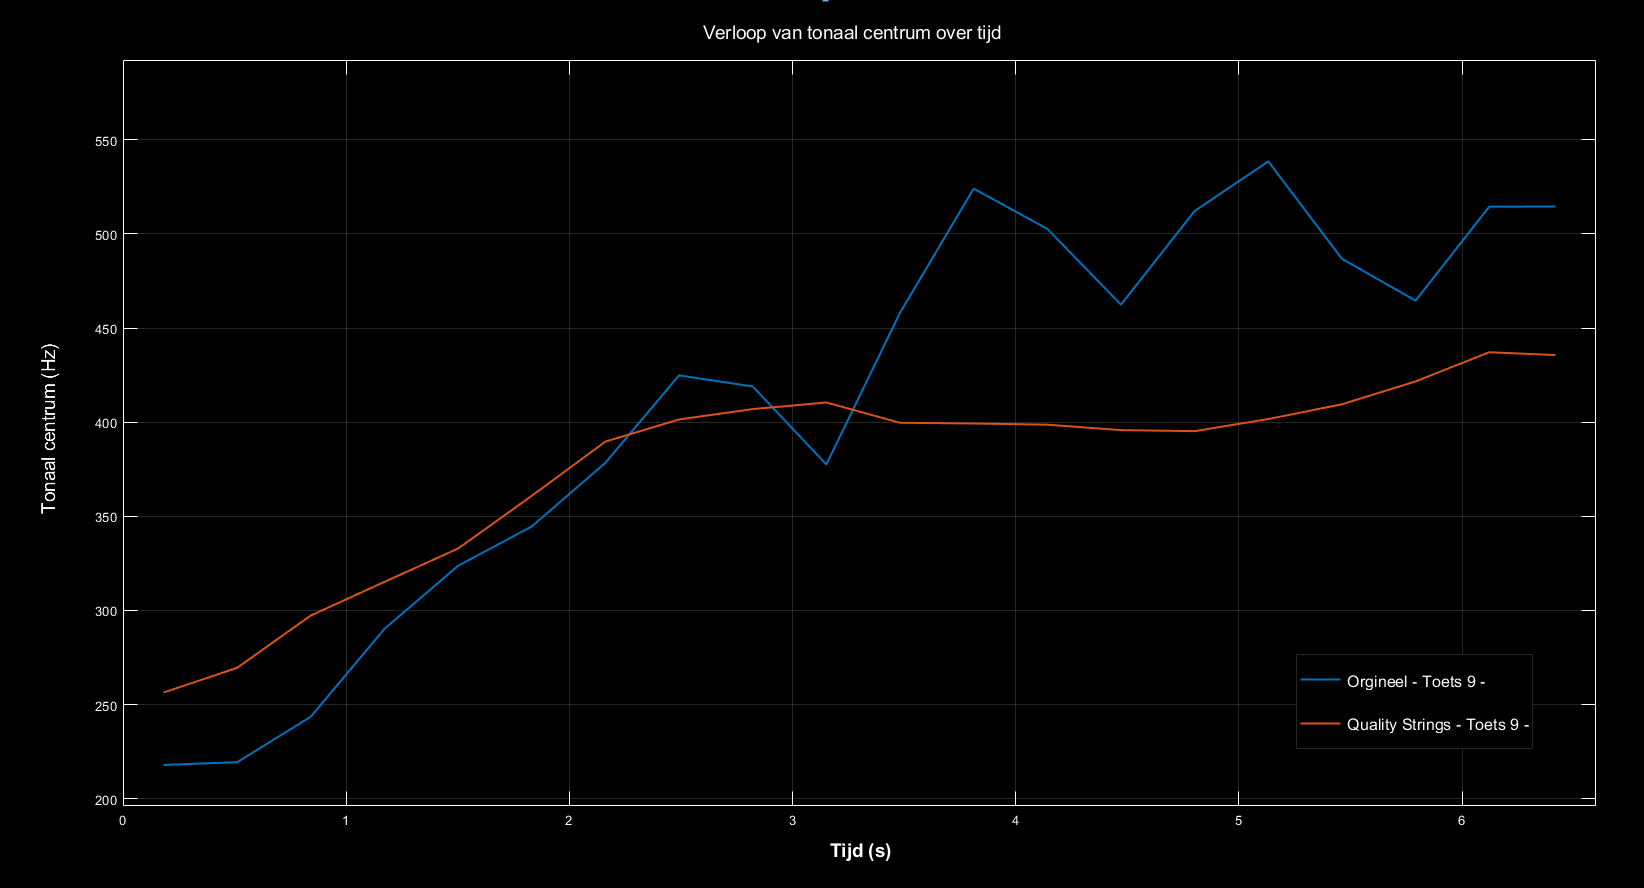
3 - Tonal center
The tonal center is the average of all audible frequencies at any given time
Here the vertical axis represents the frequency in Hz, the horizontal axis the time in seconds. The original string is shown in blue and the Quality String in orange
Here you can see the original string starts out with a slightly lower tonal center, however, it quickly rises and then fluctuates significantly as time goes on. This seems to correspond to the volume fluctuations of the higher partials as seen in the spectrogram. As the loudest 2nd partial fades out, higher ones with their volume fluctuations remain audible
Due to the stronger 3rd partial, the Quality String initially shows a higher tonal center. After this it increases less and remains more stable, without the fluctuations of the original string
A first impression
The three sample analysis are only a small glimpse of what can be done, but illustrate the ability of contemporary tools to objectively visualize sound properties
As a designer and manufacturer of strings, we can influence many variables that affect how a string sounds, including:
• Core material used
• Winding material used
• Absolute tension
• Stress rate
• Core ⌀ to winding material ⌀ ratio
• How many layers of winding material are used
• How the axial tension on the core wire during production relates to the tension after installation
• How and to what maximum the axial tension is allowed to increase during the winding process
• Build-up of radial stress within the core wire during production
• Radial stress compensation by twisting the string during installation
• Radial stress compensation by RPM offset during production
• Axial force applied to the winding material during production
• Angle winding material to core wire during production
• Applying the different finishes
By changing each variable independently and subsequently analyzing the results, more insight is gained into their effects. With this knowledge, improvements are made to the design and manufacturing process